The main purpose of this report is to establish our CO² emissions as a business to help make positive changes towards reducing our output. Although no official government guidance has been given, we feel it would be beneficial for us to begin monitoring and reporting. Not only does this give us a baseline for future carbon accounting, but it also helps us as a business become more mindful of the resources we are using.
We have seen a 27.51% increase in components made from 2022 to 2023. When we increase the number of components, the emissions produced throughout the manufacturing process will also increase. Therefore, have chosen to monitor CO² emissions against each component produced.
We have found this calculation to be more relevant from a business perspective. Allowing us to be more sustainable without it being detrimental to the business. More importantly eliminates price alterations which we feel could impact the data. This calculation takes into consideration the increased number of parts produced but gives us insight as to whether we are becoming more efficient.
Below is a breakdown of total kgCO²over all 3 scopes for periods 2022 and 2023.
| 2022 | KgCO² | No. Components made | KgCO²/pp |
|---|---|---|---|
| 249,443 | |||
| Scope 1 | 24,622 | 0.098 | |
| – Deductions Gas (kWh) | – 13,883 | – 0.056 | |
| Scope 2 | 32,653 | 0.130 | |
| Scope 3 | 155,107 | 0.622 | |
| Total | 198,499 | 0.795 |
| 2023 | KgCO² | No. Components made | KgCO²/pp | Increase/decrease on previous year |
|---|---|---|---|---|
| 318,083 | ||||
| Scope 1 | 38,290 | 0.120 | +14.29% | |
| – Deductions Gas (kWh) | – 24,602 | – 0.077 | +37.5% | |
| Scope 2 | 34,790 | 0.109 | -16.15% | |
| Scope 3 | 197,653 | 0.621 | -0.16% | |
| Total | 246,131 | 0.773 | -2.77% |
There has been a 27.51% increase of components made, however KgCO²/pp scope 3 has seen a reduction of 0.16%.
Because we are monitoring our CO² against each part made rather than against our revenue, we have not included the gas (kWh) element of Scope 1 into our final total. We feel this isn’t a true reflection of its usage within the manufacturing process as its only use is to heat the premises which can vary depending on environmental factors rather than due to an increase in production.
Scope 1 is showing an increase from 2022 to 2023 of 14.29%.
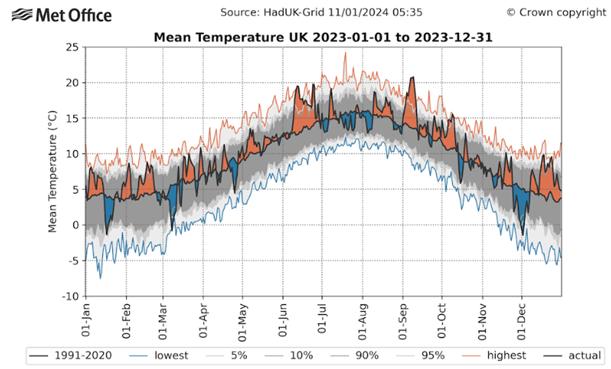
We have identified that the scope 1 increase is primarily due to the increased demand in our gas usage due to environmental factors. We can see below that 2023 had more colder periods over the winter months compared to 2022.


Even though there has been a 2.77% decrease on 2022 KgCO²/pp, there are also other factors we have established that we feel, may be impacting this reduction. Such as;
- Improved data collection
The way in which we collect data is much more accurate compared to previous periods, we believe that making this element more transparent and user friendly ensures us that no transactions are duplicated and helps us to report more easily.
We now have the capabilities to record more accurate information through an internal process. This means we can now establish the weights and distance against sub-con work and purchased raw material. By having weights against these specific elements gives us a more accurate KgCO² per delivery. This naturally will increase our emissions output, however, should give us more reliable data over the next couple of years and help us to make more informed choices.
We currently don’t include the transportation of finished goods; however, this is an element we would like to report on in the future.
- Increased revenue
As we are currently still in a recovery period, we have noticed that our turnover for the calendar years 2022 to 2023 has increased by 20.59%, increasing our raw material demand. Availability of material will also dictate the amount of material we purchase this then increases the recorded weight.
Our Scope 3 – (Bought in material) total for 2023 was 162,074 kg CO², in 2022 we recorded 133,763kg CO², giving us an 21.17% increase of emissions.
Going forward, one of the measurements we will be reporting on is the Scope 3 Materials bought in against our Scope 2 output. See table below.
| Scope 2 – Electricity | Scope 3 – Bought in material | Kg CO² | |
|---|---|---|---|
| 2022 | 32,653 kg CO² | 133,763 kg CO² | 0.244 |
| 2023 | 34,790 kg CO² | 162,074 kg CO² | 0.214 |
There is a direct correlation between revenue and our raw materials. The more components we manufacture the more raw materials we will consume, resulting in increased turnover, therefore if we monitor this against our Scope 2 output, we should be able to see whether we are utilising our electricity consumption more effectively during manufacturing.
Our second measurement is between our raw material and the remaining elements of scope 3.
| Scope 3 – Bought in material | Scope 3 (excluding bought in materials) | Kg CO² | |
|---|---|---|---|
| 2022 | 133,763 kg CO² | 21,005 kg CO² | 0.157 |
| 2023 | 162,074 kg CO² | 30,725 kg CO² | 0.190 |
We feel this is another indicator that will highlight if we are using resources more efficiently.
With an increase of components comes the increased packaging requirement. This has seen an increase of 77% from 2022 to 2023.
| KgCO² | No. Components made | KgCO²/pp | |
|---|---|---|---|
| 2022 | 318,083 | ||
| Scope 3 – Packaging | 2436 | 0.007 | |
| 2023 | 219,443 | ||
| Scope 3 – Packaging | 1376 | 0.005 |
We are continuously looking at ways to ensure all our packaging is sustainable and/or reusable, not only can this help drive down the cost factor but also to reduce the amount of non-recyclable packaging we use. We have recently invested in a cardboard shredder with the aim of replacing our plastic fill.
We are increasing the use of returnable packaging to our local suppliers, one of our main aims is to encourage local customers to allow us to send completed parts in returnable boxes. This would help us to massively drive down our need for cardboard boxes.
This is something we continue to monitor with the intentions of reducing year on year.
As a business we understand that many internal and external factors can heavily influence our emissions output, however by continuing to implement internal changes with more accurate and transparent reporting we can effectively drive down our emissions output.
Our targets for 2024 are the following:
- Reduce our electricity consumption,
- Reduce our Scope 2 vs scope 3 bought in materials kg CO²
- Reduce our Scope 3 bought in materials vs scope 3 (excluding bought in materials) kg CO²
- For 2024, we will reduce our carriage emissions with our main material supplier by around 20%.
We aim to reduce these by carrying out the following actions:
- Investing in a hybrid business van when current contract expires
- Investing in transformers for machines
- Explore options of swarf crushers


Stay In Touch